(Sample Material) CSAT Online Coaching : Data Interpretation - Pie Chart

Sample Material of Our Online Coaching Programme
Subject: Data Interpretation
Topic: Pie Chart
Directions: Study the following table to answer the given questions. Number
of Students of Different Classes of a School Playing Different Games
Class.
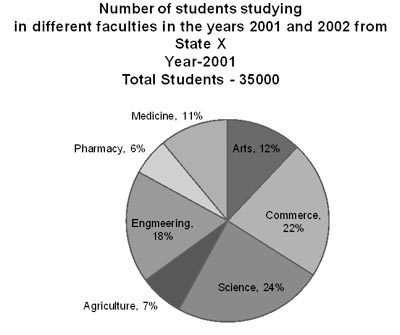
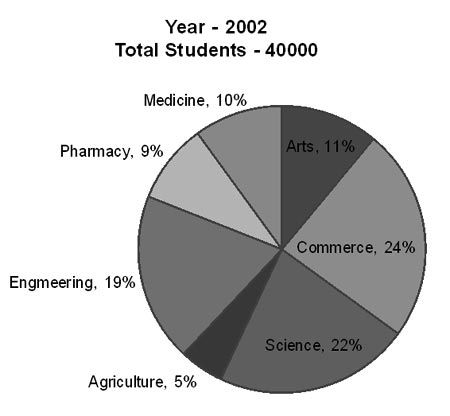
1. In which faculty there was decrease in the number of students from 2001 to 2002?
(a) None
(b) Arts
(c) Agriculture
(d) Pharmacy
2. What is the ratio between the number of students studying pharmacy in the years 2001 and 2002 respectively?
(a) 4 : 3
(b) 3 : 2
(c) 2 : 3
(d) 7 : 12
3. What was the approximate percentage increase in the number of students of Engineering from the year 2001 to 2002?
(a) 17
(b) 15
(c) 25
(d) 20
4. In the year 2001, the number of students studying Arts and Commerce together is what percent of the number of students studying these subjects together in 2002?
(a) 76
(b) 85
(c) 82
(d) 79
For Full Material Join Online Coaching
Buy CSAT Paper 2 Study Kit in Hard Copy

Whats Hot!
Downloads
- New! THE HINDU, YOJANA, PIB PDF
- New! UPSC PRELIM Papers 2004-2025
- UPSC Syllabus PDF Download
- New! IAS MAINS Papers 2010-2025
- PDF Study Notes for UPSC (Hot!)
- E-books PDF Download
- NCERT Books Download | NCERT Hindi PDF
- New! UPSC MAINS SOLVED PAPERS PDF
- OLD NCERT PDF
- UPSC 2026 Exam Calendar
- New! UPSC IAS Online Course