(Current Affairs) Economy & Energy | March: 2014

Economy
- India’s International Investment Position released (Free Available)
- Overall International Investment Position of India (Free Available)
- Composition of International Financial Assets and Liabilities of India (Only for Online Coaching Members)
- Share of External Debt and Non-Debt Liabilities of India (Only for Online Coaching Members)
- India became third largest crude oil importer in the World (Only for Online Coaching Members)
- CRISIL launched Financial Inclusix Index 2013 (Only for Online Coaching Members)
- MOT formed to reassess Hydrocarbon Resources of India (Only for Online Coaching Members)
- Currency notes issued before 2005 to be withdrawn (Only for Online Coaching Members)
- Government notified new natural Gas Pricing Formula (Only for Online Coaching Members)
- Foreign Direct Investment rules relaxed by RBI (Only for Online Coaching Members)
- India ranked lowest in International Intellectual Property Index (Only for Online Coaching Members)
- China to be become a partner in the proposed NIMZ in Andhra Pradesh (Only for Online Coaching Members)
- Natural Manufacturing Policy benefits extended to Industry Clusters (Only for Online Coaching Members)
- Kelkar panel submitted report (Only for Online Coaching Members)
- RBI selected CCIL as Legal Entity Identifier (Only for Online Coaching Members)
- India Inclusive Innovation Fund launched (Only for Online Coaching Members)
- HSBC released Services Purchasing Managers Index (PMI) (Only for Online Coaching Members)
- Sale of 10% stake in IOC to ONGC and OIL approved (Only for Online Coaching Members)
- CRISIL forecast on Indian economy (Only for Online Coaching Members)
- Guidelines on New Land Policy for Major Ports of the Country Released (Only for Online Coaching Members)
- Indian companies allowed by RBI to issue non-convertible debentures (Only for Online Coaching Members)
- Guidelines on National Mission on Oil seeds and Oil Palm (Only for Online Coaching Members)
- RBI relaxed Gold loan norms (Only for Online Coaching Members)
- RBI included Hong Kong and Macau in the sensitive list (Only for Online Coaching Members)
- IMF forecast of India Economic Growth (Only for Online Coaching Members)
- India signed a Credit Agreement with World Bank for RRSMP (Only for Online Coaching Members)
- CCI ordered fresh probe into Coal India and subsidiary for violations (Only for Online Coaching Members)
- CIL declared dividend of 290 percent for 2013-14 (Only for Online Coaching Members)
- Sale of Government’s residual stake of HZL approved (Only for Online Coaching Members)
- India to have 243 million Internet users by June 2014 (Only for Online Coaching Members)
- 2 oil and gas blocks Offered to ONGC by Sudan at Petrotech 2014 (Only for Online Coaching Members)
- Third Quarter Policy Review by RBI (Only for Online Coaching Members)
- NABARD reduced refinance rate for banks (Only for Online Coaching Members)
- 1000 rupees minimum monthly pension plan (Only for Online Coaching Members)
- Guidelines for investment in Equity Exchange Traded Funds issued by IRDA (Only for Online Coaching Members)
- New CPI for Anchoring Monetary Policy (Only for Online Coaching Members)
- Suresh Mathur panel formed by IRDA (Only for Online Coaching Members)
India’s International Investment Position released
Reserve Bank of India has released the statistical statement of the International Investment Position (IIP) of the quarter ended in September 2013. The statement shows following at a point in the time of the value and composition:
- Financial assets of residents of an economy that are claims on non-residents and gold bullion held as reserve assets
-
Liabilities of residents of an economy to non-residents The difference between an economy’s external financial assets and liabilities is its net IIP. Such balance sheet is an analysis of international accounts that will help
in understanding sustainability and vulnerability of economy’s external sector.
Important highlights of the International Investment Position (IIP) are following for the quarter-ended September 2013:
Net claims of non-residents on India (as reflected by the net IIP) decreased by US$ 12.8 billion over the previous quarter to 296.2 billion US dollars as at end-September 2013. This change in the net position reflected a US$ 10.6 billion decrease in the value of foreign-owned assets in India vis-à-vis a US$ 2.2 billion increase in the value of Indian Residents’ financial assets abroad (Table 1).
Indian residents’ financial assets abroad stood at 436.7
billion US dollars as at end-September 2013 recording a marginal increase of US$
2.2 billion over previous quarter mainly due to increase of US$ 6.8 billion in
other investment abroad including trade credit, loans and currency and deposits.
Reserve assets, decreased by US$ 5.3 billion to US$ 277.2 billion as at
end-September 2013. Direct investment increased marginally by US$ 0.6
billion.
Foreign-owned assets in India have decreased by 10.6 billion US dollars over the previous quarter to US$ 732.9 billion as at end- September 2013. The Direct investment in India has been reduced by 2.9 billion US dollars and portfolio investment in India has gone down by 13.3 billion US dollars. Among other investment liabilities, trade credit decreased by 1.9 billion US dollars and loans increased by 2.8 billion US dollars.
Effects of Rupee Depreciation: Variation in exchange rate of rupee vis-a-vis other currencies influenced change in liabilities, when valued in US dollars terms. Though there was a net inflow of US$ 6.6 billion during the period, equity liabilities in US dollars term decreased by 10.2 billion US dollars, from 340.7 billion US dollars in June 2013 to 330.5 billion US dollars in September 2013 due to the stock valuation effect resulting from rupee depreciation.
Overall International Investment Position of India
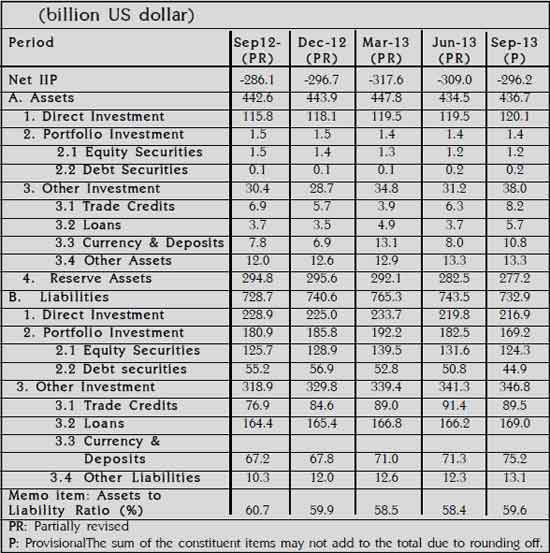
Composition of External Financial Assets and Liabilities: Reserve Assets continued to have the dominant share (63.5 percent) in India’s international financial assets in September 2013, followed by direct investment abroad (27.5 percent). Direct Investment (29.6 percent), portfolio investment (23.1 percent), loans (mainly ECBs) (23.1 percent), trade credit (12.2 percent) and currency and deposits (10.3 percent) were the major constituents of the country’s financial liabilities.
