(Sample Material) CSAT Online Coaching : Data Interpretation - Line Graphs

Sample Material of Our Online Coaching Programme
Subject: Data Interpretation
Topic: Line Graphs
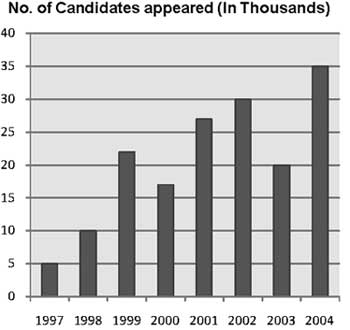
Number of candidates appeared (In thousands) and Percentage of candidates qualified in a Competitive examination over the years
No. of Candidates appeared (In Thousands)
Percentage of Candidates Qualified
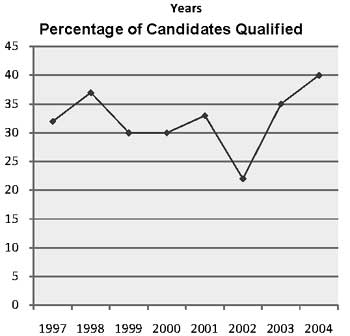
1. What was the ratio between the number of candidates appeared in 1997 and the number of candidates qualified in 2004?
(a) 14 : 5
(b) 5 : 14
(c) 3 : 7
(d) Data inadequate
2. In which of the following years was the number of candidates qualified the lowest among the given years?
(a) 1997
(b) 2002
(c) 2001
(d) 1998
3. What was the percentage drop in the number of candidates appeared from the year 2002 to 2003?
![]()
(b) 30
(c) 70
(d) None of these
4. How many candidates qualified in the year 2002?
(a) 6750
(b) 13500
(c) 9900
(d) Cannot be determined
