(Sample Material) IAS Online Coaching : Data Interpretation - Table Chart

Sample Material of Our Online Coaching Programme
Subject: Data Interpretation
Topic: Table Chart
Directions: Study the following table to answer the given questions. Number
of Students of Different Classes of a School Playing Different Games
Class.
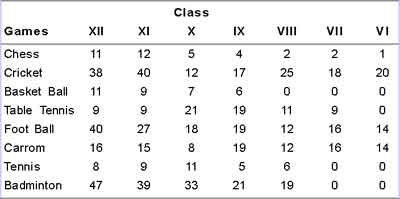
1. Approximately what percent of VIIIth class students play Cricket out of the total students playing Cricket?
(a) 13
(b) 4
(c) 25
(d) 15
2. What is the respective ratio of XIth and Xth class students playing Foot Ball?
(a) 1 : 2
(b) 2 : 5
(c) 2 : 3
(d) 3 : 2
3. Which game is the most popular?
(a) Badminton
(b) Foot Ball
(c) Carrom
(d) Cricket
4. Approximately what percent of Xth class students play Table Tennis out of the total Xth class students playing different given games?
(a) 20
(b) 21
(c) 27
(d) 18
For Full Material Join Online Coaching
Buy CSAT Paper 2 Study Kit in Hard Copy

Whats Hot!
Downloads
- New! THE HINDU, YOJANA, PIB PDF
- New! UPSC PRELIM Papers 2004-2026
- UPSC Syllabus PDF Download
- New! IAS MAINS Papers 2010-2025
- PDF Study Notes for UPSC (Hot!)
- E-books PDF Download
- NCERT Books Download | NCERT Hindi PDF
- New! UPSC MAINS SOLVED PAPERS PDF
- OLD NCERT PDF
- UPSC 2026 Exam Calendar
- New! UPSC IAS Online Course