(Download) UPSC IAS Mains Exam Paper - 2017 : Statistics
![]()
(Download) UPSC IAS Mains Exam Paper - 2017 : Statistics
STATISTICS
Paper - 1
Time Allowed : Three Hours
Maximum Marks : 250
QUESTION PAPER SPECIFIC INSTRUCTIONS
(Please read each of the following instructions carefully before attempting questions)
There are EIGHT questions divided in two Sections and printed both in HINDI and in ENGLISH.
Candidate has to attempt FIVE questions in all.
Question Nos. 1 and 5 are compulsory and out of the remaining, THREE are to be attempted choosing at least ONE question from each Section.
The number of marks carried by each question/part is indicated against it.
Answers must be written in the medium authorized in the Admission Certificate which must be stated clearly on the cover of this Question-cum-Answer (QCA) Booklet in the space provided. No marks will be given for answers written in a medium other than the authorized one.
Assume suitable data, if considered necessary, and indicate the same clearly.
Unless and otherwise indicated, symbols and notations carry their usual standard meanings.
Attempts of questions shall be counted in sequential order. Unless struck off, attempt of a question shall be counted even if attempted partly. Any page or portion of the page left blank in the Question-cum-Answer Booklet must be clearly struck off
SECTION-A
Q1. (a) Ten percent of a certain population suffer from a serious disease. Two independent tests are given to a person suspected of the disease. Each test gives a correct diagnosis 90% of the time. Find the probability that the person really suffers from the disease, given that,
(i) both tests are positive
(ii) only one test is positive.
(b) Let X be a continuous random variable with the probability density function

Find the cumulative distribution function and the probability density function of Y = x2.
(c) Let {Xn} be a sequence of independent and identically distributed random variables with common probability function
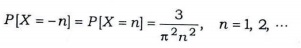
Check whether {X} obeys the (it) strong law of large numbers and (i) weak law of large numbers.
(d) Let x1, x2,..., Xn be n observations, each independently uniformly distributed between 0-1/2 and 0+1/2 Find a general form of maximum likelihood estimator (MLE) of 0. Verify that
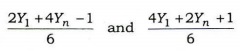
are both MLEs, where Y1 = Min Xi and Yn, = Max Xi.
(e) Let X1, X2, ..., Xn, be a random sample from uniform population over (O, 0) and let M = Max (X1, X2, ..., Xn). Show that M is a biased but consistent estimator of 0.
Q2. (a) Let X1, X2, ..., Xn be independently and identically distributed observations from a distribution with probability density function f0(x). If Y = g(X1, X2, ..., Xn) is an unbiased estimate of 8, then
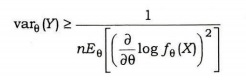
Use this inequality to show that the sample mean is a uniformly minimum variance unbiased estimator of mean of a Poisson distribution.
(b) State and prove Chebyshev's inequality. Hence or otherwise, prove that (i)
P[X<l/2]< 4/l and (ii) P[X >2l]
<1/l. if X is any positive random variable having both mean and variance
equal to l.
(c) In a Community of (a + b) potential voters, a are for abortion and b(b<a)
are against it. Suppose that a vote is taken to determine the will of the
majority with regard to legalizing abortion. If n(n <b) random persons of these
(a + b) potential voters do not vote, what is the probability that those against
abortion will win?
Q3. (a) X1 is the time that a customer takes from getting on line at a service desk in a bank to completion of service and X2 is the time to wait in line before reaching the service desk (X1>X2). The joint probability density function of (X1, X2) is given by
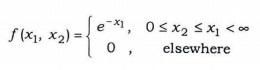
Let Y1 = X1 + X2 and Y2 = X1-X2. Find the joint probability density function of Y1 and Y2. Are Y1 and Y2, independently distributed? Give reason.
(b) Let X1, X2, X3 and X4 be independent and identically distributed random variables each having probability density function

Find the cumulative distribution function and probability density function of Y = Min (X1, X2, X3, X4).
(c) Using Kolmogorov-Smirnov test, determine whether the sample data given below come from an exponential distribution with mean 4. The observations in the sample are
0.7, 5.5, 5.7, 4.3, 0.8, 1.1, 5.1, 4.9, 2.0, 3.9, 5.3, 4.2, 5.2, 5.8, 6.0 (Given, D13, 0.05 = 0.361, D14, 0.05 = 0.349, D15, 0.05 = 0.338)
Q4. (a) Let X1, X2,.., Xn be a random
sample from a distribution with probability density function
f(x) = qxq-1,
0< x <1, q >0
Find the maximum likelihood estimator (MLE) and minimum variance unbiased
estimator (MVUE) of q.
(b) If the random variable X follows normal distribution N(m,
1), then find the Y = 1-0(X)/0(x), where 0 and o denote the cumulative
distribution function and probability density function respectively of N(0, 1),
the standard normal distribution.
(c) Let X1, X2, ..., Xn be a random sample from
a normal population with mean u and variance 25. For a sample size of n=16, find
the uniformly most powerful (UMP) test for testing the simple null hypothesis Ho
: u = 5 against the composite alternative hypotheses (i) H1: u >5 and
(ii) H1: u <5.
SECTION-B
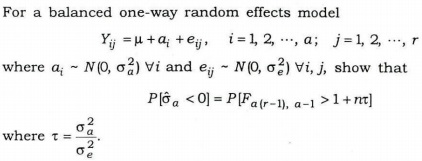
Q5. (a) Y1, Y2, Y3, Y4, are four independent variables with E (Y1) = E (Y3) = q1, +q3 +q4, E (Y2) = E (Y4) = q1-q2 and V(Yi) = q2 (for i = 1, 2, 3, 4). Verify whether q1+q3 and q2,+q3 + q4 are estimable. If so, obtain their BLUEs. Also obtain the variances of the BLUES.
(b) Let X = [X1, X2, X3] have trivariate normal distribution N3 (m, S), where
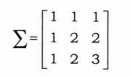
Show that (X2-X1)2 + (X3-X2)2
degrees of freedom.
(c)
(d) An investigator selects 10 one-acre plots by simple random sampling and counts the number of trees (y) on each plot. She also has aerial photographs of the plantation from which she can estimate the number of trees (x) on each plot of the entire plantation. Hence, she knows sym mx = 19.7 and since the two counts are approximately proportional through the origin, she uses a ratio estimate to estimate my. The data yield the following:

N = 1000 (plantation size), n = 10 (taken by SRS)
yi = The actual count of trees in one-acre plots, i = 1, 2, ..., 10
xi = The aerial estimate for each plot
y = 22.10, x = 20.80
(e) Explain the concept of balanced incomplete block design (BIBD). What are the conditions for existence of a BIBD? If V = {1, 2, 3, 4, 5, 6, 7), then form a number of blocks, each of order 3, such that each pair of elements in V is contained in exactly one block.
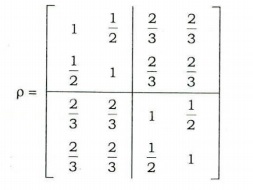
Q6. (a) Obtain first canonical correlation and its associated canonical variable pair for the following correlation matrix :
(b)
(c) Distinguish between a factorial experiment and a number of single-factor experiments. What is meant by confounding in a factorial experiment? Why is confounding preferred even at the cost of loss of information on the confounded effects?
Q7. (a) Explain the method of systematic sampling and give its merits
and demerits. How do you estimate the sampling variance of the estimate of the
population total? Show how systematic sampling is a particular case of cluster
sampling.
(b) Suppose n1 = 11 and n2 = 12 observations are made on
two random vectors X1 and X2 which are assumed to have
bivariate normal distribution with a common covariance matrix
S, but possibly different mean vectors
m1, and m2.
The sample mean vectors and pooled covariance matrix are
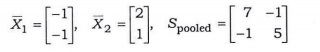
Obtain Mahalanobis sample distance D2 and Fisher's linear discriminant function. Assign the observation X0 = (0, 1) to either population p1 or p2.
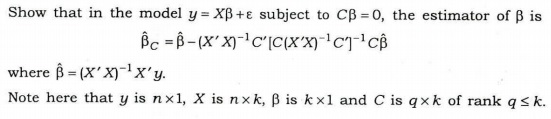
(c) Let y1 = b1-b2 +e1, y2 = b3 +e2 and y3 = b1 +b2 +e3, where e1, e2, and e3 are N (0,0). Obtain best linear unbiased estimator (BLUE) of (2b1 -b2). Is this linear parametric function testable?
Q8. (a) Three sides of an equilateral triangle were measured by 5 persons with the following results :
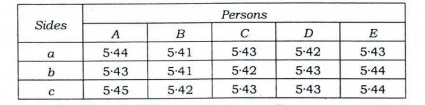
Is there any significant difference between (i) measurements by the persons and (ii) the sides of the triangle?
(b)
(c) Derive the expression for the variance of Horvitz-Thompson estimator (HTE)
of population total. Point out the difficulty faced in estimating it. Find
Yates-Grundy variance estimator.

DOWNLOAD 10 YEARS UPSC MAINS STATISTICS PAPERS PDF
DOWNLOAD UPSC MAINS G.S. (1-4) SOLVED PAPERS PDF
DOWNLOAD UPSC MAINS G.S. 10 Year PAPERS PDF
DOWNLOAD UPSC IAS EXAMS E-BOOKS PDF
UPSC Mains General Studies Study Kit
STATISTICS
Paper - 2
Time Allowed : Three Hours
Maximum Marks : 250
QUESTION PAPER SPECIFIC INSTRUCTIONS
(Please read each of the following instructions carefully before attempting questions)
There are EIGHT questions divided in two Sections and printed both in HINDI and in ENGLISH.
Candidate has to attempt FIVE questions in all.
Question Nos. 1 and 5 are compulsory and out of the remaining, THREE are to be attempted choosing at least ONE question from each Section.
The number of marks carried by each question/part is indicated against it.
Answers must be written in the medium authorized in the Admission Certificate which must be stated clearly on the cover of this Question-cum-Answer (QCA) Booklet in the space provided. No marks will be given for answers written in a medium other than the authorized one.
Assume suitable data, if considered necessary, and indicate the same clearly.
Unless and otherwise indicated, symbols and notations carry their usual standard meanings.
Attempts of questions shall be counted in sequential order. Unless struck off, attempt of a question shall be counted even if attempted partly. Any page or portion of the page left blank in the Question-cum-Answer Booklet must be clearly struck off
SECTION-A
Q1.(a) Explain
(i) Natural tolerance limits
(ii) Trial control limits
(iii) Specification limits
(iv) Modified control limits
(b) Define a saddle point for any general function in two variables. State
and prove a necessary and sufficient, condition for the existence of a saddle
point in pure strategic for a two-festoon zero-sum rectangular game.
(c) For a single sampling plan, (N, n, c) = (50, 15, 1), compute the probability
of acceptance of lots of 50 articles with 2% defective.
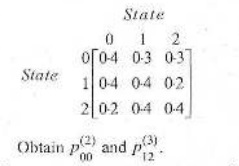
(d) Define a transition probability matrix of a Markov chain and state some of
its properties. For a Markov chain with three states 0, 1 and 2, the transition
probability matrix is given by
(e) What is hazard function ? Suppose a system has the hazard function given by
h(t) = 3t2,t>0 Derive the reliability function. What is the name of
the underlying distribution function ? Name the parameters of the distribution
and specify their values for the above system.
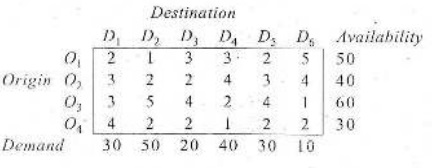
Q2. (a) Find a necessary and sufficient condition for the existence of a feasible solution to a Transportation problem (T.P). Find the solution of the T.P with following cost matrix :
(b) State how a queuing model is completely specified. In this context,
explain the meaning of different symbols use in the queuing model (M/M/C).
Obtain the stready-state equations under the model (M/M/C).and find their
solution.
(c) (i) What is a counting process? What are the basic properties of a counting
process ? Define a renewal process and the renewal function.
(ii) If the renewal function is m(f) = 2t, t>0 find the
corresponding renewal process.
(iii) Suppose X1, X2 ... are the inter arrival time of a renewal process (N(t),
t>0). Assume that X1s are independent are identically distributed
with P(X1=1) P(X1=2)-1/2. Find the P(N(t) = k) for K= 6, 7
and t = 7.7. What are the other possible values of N(7.7)?
Q3. (a) Samples of size 4 are drawn to construct a control chart for X. The
central line is at 100 and LCL and UCL are at 96 and 104 respectivily. If the
measured characteristic is normally distributed with mean of 98 and standard
deviation of 4, what is the probability that the control chart will raise an
out-of-control alarm at the fourth sample?
(b) Explain left, right and arbitrary censoring in life testing. Cite an example
for each of these types. Assuming that the life time follows exponential
distribution with failure rate l derive the maximum
likelihood estimator for the average life time for the following right censored
data:
t1 =88, t2 = 105 t3 = 141, t4 = 344 t5 =430, t6 = 516 t7 = 937, t8 = 1057 ti > 1100 for i = 9, 10, ..., 15.
(c) What is the linear programming problem and how it can be represented in
the form of matrix notations?
Given the following constraints:
6x1 + 3x2 -4x3 < 60
2x1 + 4x2 -4x3 < 40
3x1 + 3x2 -3x3 < 60
x1, x2, x3 >0
maximize the objective function Z = 3x1 + 2x2 + 6x3
using simple method.
Q4. (a) In a capability study of a process involving manufacturing items, the specification limits are given as 23.75 +0.1. From the manufactured items, six items were selected each day consecutivety for eight days. The measurement obtained are given below in excuse of 23. (That is, for example the first cell value 0.77 should be read as 23.77).

(i) Construct X and R charts
(ii) Compute the process capability of the machine.
(iii) Will the process meet the specifications ?
(b) Define n-step transition probablity in a Markov chain. Prove that the following Chapman-Kolmogorov equation:
(c) Discuss the single period continuous probability inventory model with
instantancous demand shortage and continous replenishment.
The probability distribution of demand D is given by
The holding cost is Rs. 0.50 per day and the shortage cost is Rs. 3.20 per
day.
Determine the optimum order level of the inventory.
SECTION-B
Q5. (a) Distinguish between stable and stationary populations.
(b) Briefly discuss about the Box-Jenkins method of forecasting.
(c) What is Multicollinearity ? Give its consequences.
(d) Explain different measures of Mortality.
(e) What is Z-score, Standard score and Normalised score in psychological
statistics
Q6. (a) Define Time series. Give its components and explain each of them.
(b) The sex-wise distribution of population and number of births along with survival rates of a town in 2011 are given below:

Find
(i) General Fertility rate (GFR)
(ii) Age specific fertility rate (ASFR)
(iii) Total fertility rate (TFR)
(iv) Gross Reproduction Rate (GRR)
(v) Net reproduction rate (NRR)
(c) What is Reliability of Test Scores? Explain Test-Retest method and parallel form method of determining test Reliability mentioning their merits and limitations.
Q7. (a) Given below are the average wage in Rupees per hour of unskilled workers of a factory during the period 2005-2010 and corresponding consumer price index number taken 2005 as base year with price index equal to 100. Determine the real wages of the workewrs during 2005-2010 compared with the wages in 2005.
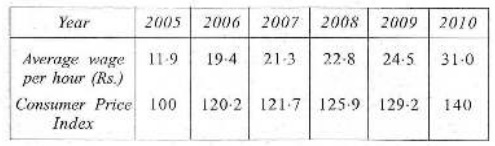
Also find the worth of one rupee in each subsequent year compared to one rupee in 2005.
(b) The data on quarterly prices in rupee per kilogram of a commodity during 2005 to 2009 are shown below:

Compute the seasonal index by the simple average method and obtain depersonalized values.
(c) What is logistic curve? Explain the method of three selected points for fitting the logistic curve to a population data.
Q8. (a) Complete the following life table of the population of a certain type of insects, x being age in days = 100

(b) Briefly discuss about the official statistical system in India.
(c) Define Index Number. Give its uses and limitations.
